
01
For buyers agents · South East Queensland · From the builder, Tekna Homes
We only build
what the data
backs.
Tekna Homes is a South East Queensland builder. Our data picks the suburb and the inclusions, so every deal is one you can defend to your client.
See the Southside proof →- Data picks the suburb
- Data picks the inclusions
- Designed and built by us
Swipe for more →
- 900,000+
- SEQ sales analysed
- 575
- Suburbs screened
- 17 years
- Of history tested against
- 30 of 57
- Features tested significant
Who we are
A South East Queensland builder that lets data decide.
We’re the builder, not a reseller. We don’t resell or package someone else’s stock. The team that picks the land designs the home and builds it, so one team is accountable from land to handover.
02
Full turnkey builds, managed end to end. We handle certification and approvals, with inspections at every stage of construction.
03
Our own suburb-selection and inclusions data decides what we build, where, and why, so we don’t guess.
The problem
New builds are easy to get wrong, and hard to defend.
We spent hours with agents trying to work out exactly what to build to find margin on a small development. What we kept hearing was useful but narrow: it came from what each agent had sold before. Nobody could put a number on which inclusions were actually worth it.
01
Over-capitalised. Money goes into the build that the sale price doesn’t return.
02
Generic spec. Inclusions picked by habit, not by what buyers actually pay for.
03
Wrong suburb. A good-looking build in an area that doesn’t support the price.
04
Hard to justify. When your client asks “why this one?”, the answer is a brochure.
You carry that risk with your client. We built our process to take the guesswork out of it.
How we solve it
Data decides where we build, and what goes in.
01
Pick the suburb. We screen 575 SEQ suburbs on 900,000+ sales across 17 years, then score the shortlist by hand, weak spots included.
02
Test what buyers pay for. We tested 57 features against sold prices. 30 came out significant. If a feature’s effect can’t be separated from zero, we drop it.
03
Build only that. We design and build it ourselves, and spend only where the data says value follows.
An example of the data steering us: we tested suburbs declared Priority Development Areas, the state’s fast-tracked growth zones, against similar nearby suburbs. Three years after the declaration, prices in the declared areas had grown more slowly, likely because of the extra supply. So a fast-tracked growth area isn’t automatically a buy for us. We look at how much new supply is coming.
Where to build
Every SEQ suburb is ranked before we look at a block.
Every suburb pick is backed by how the same homes have actually resold over 17 years, not by brochure promises: over 900,000 real sales across 575 suburbs. Ranked on repeat sales of the same homes, a dated infrastructure and zoning timeline, buyer and renter demand, and price and rent levels.
17 years
The ranking has been tested against 17 years of history.
575
Suburbs screened. Announcements don’t move the ranking. Only evidence in sales data does.
What goes in
Build to what buyers pay for, not over it.
Every build choice is checked against what real buyers actually paid for that feature. A pool costs the same to build anywhere, but buyers in different suburbs value it differently. No over-capitalising.
30
57
30 of the 57 features we tested have a measured effect on sale price. Unclear evidence is dropped, not published.
Why trust the numbers
Ranges, not promises.
Every new sale goes back into the model, so the ranges tighten over time.
01
Every feature value comes from real, dated sales, not from our build prices or our opinions.
02
If we can’t separate a feature’s effect from zero, we drop it. We tested 57 features and 30 made the cut.
03
We publish ranges, not promises. Where the evidence is thin, we say so, and we show the weak spots upfront.
The proof
Southside, Gympie: our data in action.
A single-storey duplex on Johnstone Rd: four bedrooms, two bathrooms and a garage per side. Ducted air and 2.74 m ceilings are standard. Figures are per side and gross, with the source beside them.
Why this area, and the weak spots
Why we chose Southside
- Renters have almost nowhere to go: vacancy is 0.63%. SQM · Sep 2026
- New 4-bed leases rent for ~$680/wk. RTA bonds · Sep qtr 2026
- New 3-bed leases are $650/wk, against $580/wk across the postcode. RTA · Sep qtr 2026 $580 = RTA postcode 4570
- People are moving in: Gympie–South grew 5.4% to 9,079 people. ABS · Jun 2025
- The big infrastructure is already built: the Gympie Bypass opened beside the suburb in Oct 2024. TMR
- Council has planned it for growth, with a structure plan approved Jan 2017. Gympie Regional Council
- Mostly owner-occupied: only 29% of homes are rented. ABS Census 2021
- Houses: median ~$820k, 171 sold, 33 days on market (31 for 4-beds). REA · 12m to Sep 2026
The weak spots, upfront
- New supply is ahead of need: ~467 dwellings approved a year against ~241 projected need. ABS · QGSO
- Flood history: the Mary River, including Feb 2022. A lot-level flood check is pending.
- Prices have dipped before: −8.4% in 2019, −8.2% in 2011 (a flood year), −1.7% in 2022–23. REA medians
- Inflation is above target: CPI 4.0%. ABS · Aug 2026
- Stress tests have not been run yet.
- Nearby sold duplex halves were 3-beds, so there is no direct 4-bed comparison.
That is why Southside scores 3/5, not a perfect 5. We’d rather show you the weak spots and our reasons than a perfect score. This is a scorecard, not a price forecast. Open any row below to see each figure with its source.
Our data scorecard: 3/5
Our data scorecard
3/5Eight categories. Built or funded projects only. Risk testing left unscored until it is done.
- Sales and prices4/5Median cross-checked across sources.
Evidence
- House median ~$820k, 171 sales, 33 days on market (31 for 4-beds). REA · 12m to Sep 2026
- Other estimates range from $786k to $837k. Heatmaps · Jan–Sep 2026 Onthehouse AVM · Sep 2026
- 4-bed house median $857.5k (96 sold), background only, not the duplex value. REA · 12m to Sep 2026
- House sales: 194 in 2021, 140 in 2022, 167 in 2023 and 174 in 2024. REA · calendar years
- Rents5/5Under 1% vacancy; new leases above the postcode.
Evidence
- Vacancy 0.63% in postcode 4570. A balanced market is ~3%. SQM · Sep 2026
- 4-bed new-lease rent $680/wk. RTA · Sep qtr 2026
- 3-bed new-lease rent $650/wk, against $580/wk. RTA · Sep qtr 2026 $580 = RTA postcode 4570
- Demand and supply2/5Renters are queuing, but supply is ahead of need.
Evidence
- ~467 dwellings approved a year, against a projected need of ~241 a year for 2026–31. ABS · 12m to Aug 2026 QGSO
- 1,417 approved lots not yet built, Gympie council area. QGSO · Mar qtr 2026
- 73 residential lots approved in the year to Mar 2026, Gympie council area. QGSO
- 451 new dwellings approved in FY2025–26, Gympie council area. ABS
- People4/5Gympie–South grew 5.4% in a year.
Evidence
- Gympie–South went from 8,610 to 9,079 people, up 5.4%. ABS · Jun 2025
- Median household income $1,175/wk. ABS Census 2021
- 38.8% owned outright, 30.0% owned with a mortgage, 29.2% rented. ABS Census 2021
- Gympie South State School: 518 students, ICSEA 955. Qld DoE · Aug 2025 ACARA · 2025
- 5,236 trading businesses in the Gympie council area (not Southside alone), up 167 (+3.3%). ABS · Jun 2025
- Infrastructure and planning4/5The bypass is built; planning-only projects get no credit.
Evidence
- Credited: the Gympie Bypass, opened Oct 2024. TMR
- Credited: the council growth area, structure plan approved Jan 2017. Gympie Regional Council
- Not credited yet, planning stage only: the Nambour to Gympie North rail study, the Gympie Hospital business case, the Curra industrial estate, and Borumba pumped hydro.
- Market and economy2/5Inflation above target.
Evidence
- CPI 4.0%; trimmed mean 3.6%. ABS · Aug 2026
- Unemployment 4.5% in Qld, 4.7% nationally. ABS · Sep 2026
- Wages up 3.2%. ABS · Jun qtr 2026
- Risk2/5Flood history; lot-level check pending.
Evidence
- Known Mary River flood history, including Feb 2022. A lot-level flood check against council mapping is pending.
- Past median falls: −8.2% in 2011 (a flood year), −8.4% in 2019, −1.7% through the 2022–23 rate hikes. REA medians
- Risk testingNot scoredStress tests not yet run.
Key numbers at a glance
Rental vacancy
Renters have almost nowhere to go.
Postcode 45700.63%
Balanced market~3%
SQM Research · Sep 2026
New-lease rent, 4-bed house
What each side of our duplex is.
Southside$680/wk
RTA new bonds · Sep qtr 2026
New-lease rent, 3-bed house
Southside rents sit above the postcode.
Southside$650/wk
RTA postcode 4570$580/wk
RTA bonds · Sep qtr 2026
Population, Gympie–South
People are moving in.
Jun 20259,079
Jun 20248,610
ABS · Jun 2025 · up 5.4%
New homes per year, Gympie region
Supply is running ahead of need: a watch-out.
Approved467
Projected need241
ABS approvals · 12m to Aug 2026 · QGSO 2026–31 medium
House sales per year
Steady turnover since the 2022 dip.
1942021140202216720231742024
REA · calendar years
House median, three sources
~$820k, with estimates from $786k to $837k.
$786k
Heatmaps · Jan–Sep 2026$820k
REA · 12m to Sep 2026$837k
Onthehouse AVM · Sep 2026
Heatmaps · Jan–Sep 2026$820k
REA · 12m to Sep 2026$837k
Onthehouse AVM · Sep 2026
171 sales, 33 days on market (31 for 4-beds) · REA
Past median falls
Prices have dipped before. We show it.
2019−8.4%
2011 (flood year)−8.2%
2022–23 rate hikes−1.7%
REA medians, not quality-adjusted
Sources: ABS, QGSO, RTA, SQM Research, REA, Onthehouse, Heatmaps, TMR, Gympie Regional Council. Figures as at Oct 2026. Rents are market figures, not a forecast return. Other sources put 4-bed rent at $660–$670/wk (REA 12m; RTA postcode 4570).
What we’re building, and why
Ducted air and 2.74 m ceilings are standard on Johnstone Rd. On top of that we add only what the data says earns its keep.
A country farmhouse style duplex. Tap the dots on the mockups to see each item’s value. Images are design mockups and renders, not photos. Final finishes may change.
What each feature adds
Tap the dots on the mockups to see each item. Figures are per side. The tiles ($13k–$28k) range and the 900mm appliances (+5.1%, n=34, ~$17k conservative) come from measured sales data: Hedonic’s models of sold listings, comparing homes whose listings mention the feature with similar homes that don’t. For tiles the low end is the conservative reading and the high end the model’s central estimate. The vanity ($6k–$8k) is our own Tekna estimate. The mirror, tapware, checkerboard floor, polished concrete and skirting ranges are Tekna assumptions: modest figures we chose in proportion to cost, not measured from sales. Don’t add them up: the benefits overlap, because buyers pay for the finished home, not each item.
Cost of upgrade = extra over builder’s grade, from Tekna’s price book and retail prices, supply only, prices may exclude GST. Mirror ~$500, brass tapware ~$1.8k, polished concrete ~$5.7k (range $2.5k–$9k depending on finish) and checkerboard floor ~$200 come to ~$8.2k a side. Tiling both bathrooms floor to ceiling instead of standard height is ~$2.5k a side (~26 m² of extra wall tile and laying, plus cleaning and silicone; our estimate of the area from the plan). A floating vanity is ~$200 a side (Otti Bondi 1200 mm wall-hung vanity at The Blue Space sale price, against our standard vanity). 900mm appliances are ~$2.7k a side. Ducted air and 2.74 m ceilings are standard on Johnstone Rd and are not listed as upgrades. All eight optional items come to ~$13.6k a side. That is what they cost us, not added value, and it is not added to the estimates above or the measured +$30k.
Measured sales data, for comparison: homes listing two or more of these finishes sold for ~$30k more per side than similar homes without them (conservative, measured as one package, not stacked). End value is to be confirmed by valuation.
What a finished side should be worth
| Figure | Per side | Confidence | Note |
|---|---|---|---|
| Model base without ducted (context) | ~$710k–$760k | Measured from sales | Hedonic model, 781 Southside house sales. House premiums, not duplex. Context only: this build already includes ducted air and 2.74 m ceilings. |
| This build: ducted + 2.74 m standard | ~$800k class band ~$765k–$820k · ±~10% | Tekna estimate | Not a model prediction. Don’t add the ducted lift (+7.9%) or any ceiling premium again. |
| 900mm appliances (upgrade) | +5.1% · n=34 | Measured from sales | 95% CI +0.8% to +9.6%. The package uses a conservative ~$17k, inside the +$30k cap. Don’t stack the 5.1% on top. |
| Defensible target, finished 4-bed side | ~$800k–$830k | Tekna estimate | Estimate, not a prediction · ±~10%. To be confirmed by valuation. |
| Nearby sold halves | $725k / $715k | Public sales | 12 Farmer Ct $725k (8 May 2026, 3-bed duplex/semi); 1 Brickfields Cres $715k (16 Jan 2026, may be a house). Both 3-beds, so not a direct comparison. |
Smaller extras, each on its own
| Extra | Premium on its own |
|---|---|
| Plantation shutters | +4.4% (uncertain) |
| Water tank | +3.7% |
| Multiple living areas | +3.2% |
| Stone benchtops | +3.0% |
| Alfresco | +2.2% |
| Walk-in robe | +2.2% |
| Solar | +2.0% |
Don’t add these up. Each extra is worth ~2–4% on its own, but they overlap: homes with one tend to have the others, so a stacked total isn’t credible.
Caveats: model estimates from 781 Southside house sales (2015–2026), using listing text and photo analysis. Error on recent sales is ~10% (~$67k). The premiums are measured on houses, not duplexes. Photo-based parts are provisional until the fine-tuned model reruns. End value is to be confirmed by valuation.
We’ve bought the land and we’re building it ourselves
Land
$345k
Settled Oct 2026 · ~$172.5k per side
Build, both sides
$599.75k
~$299.9k per side · Tekna build estimate
Land + build
$944.75k
~$472.4k per side · before other costs
Conservative case · arithmetic only
~$485.25k
Gross profit if sold at $715k a side. The two nearby sold halves were 3-beds ($715k and $725k), and the $715k one may be a house.
| Per side | Both sides | |
|---|---|---|
| End value | $715k | $1,430k |
| Land + build | $472.38k | $944.75k |
| Gross profit | ~$242.63k | ~$485.25k |
Our working target is ~$800k–$830k a side (Tekna estimate, not a model prediction), so $715k is deliberately conservative. Estimates from our feasibility model. Gross, before fees, duty, holding, selling and tax. End value is to be confirmed by valuation; there’s no bank valuation yet. Not a promise of returns.
Which upgrades pay
How it works: ticked items can lift value by up to the smaller of the low ends of their benefit ranges added together (tiles and 900mm appliances from measured sales data, vanity a Tekna estimate, the rest Tekna assumptions) or the measured +$30k package, so it stays conservative. Net gain is that lift less the upgrade cost. It is a guide to what is worth adding, not an end-value forecast.
Want to test your own numbers on this one?
Talk through this deal with JoshuaFor buyers agents
Bring us a client. We’ll put the deal together.
01
You bring the client. We bring the data and the build.
02
Numbers you can show. Every figure has its source and its caveat beside it.
03
Chosen by evidence. Suburb and spec are picked by data, not habit, so there’s a reason behind every inclusion.
For agents only
The full ranking is shared when it’s relevant.
The suburb order and feature effects are shared when we talk through a specific suburb or site. Southside is shown here as one worked example.
Where to build
575 suburbs, screened
The full ranking isn’t published. No suburb and no score is shown.
Four rows stand in for the ranking. No suburb and no score is shown.
What goes in
30 features, measured
The price effect is withheld. No feature is named here.
Four rows stand in for the feature effects. No feature and no price is shown.
We rank suburbs on their fundamentals. We don’t promise a sale price. Book a meeting.
Other designs
A few of the other homes we build
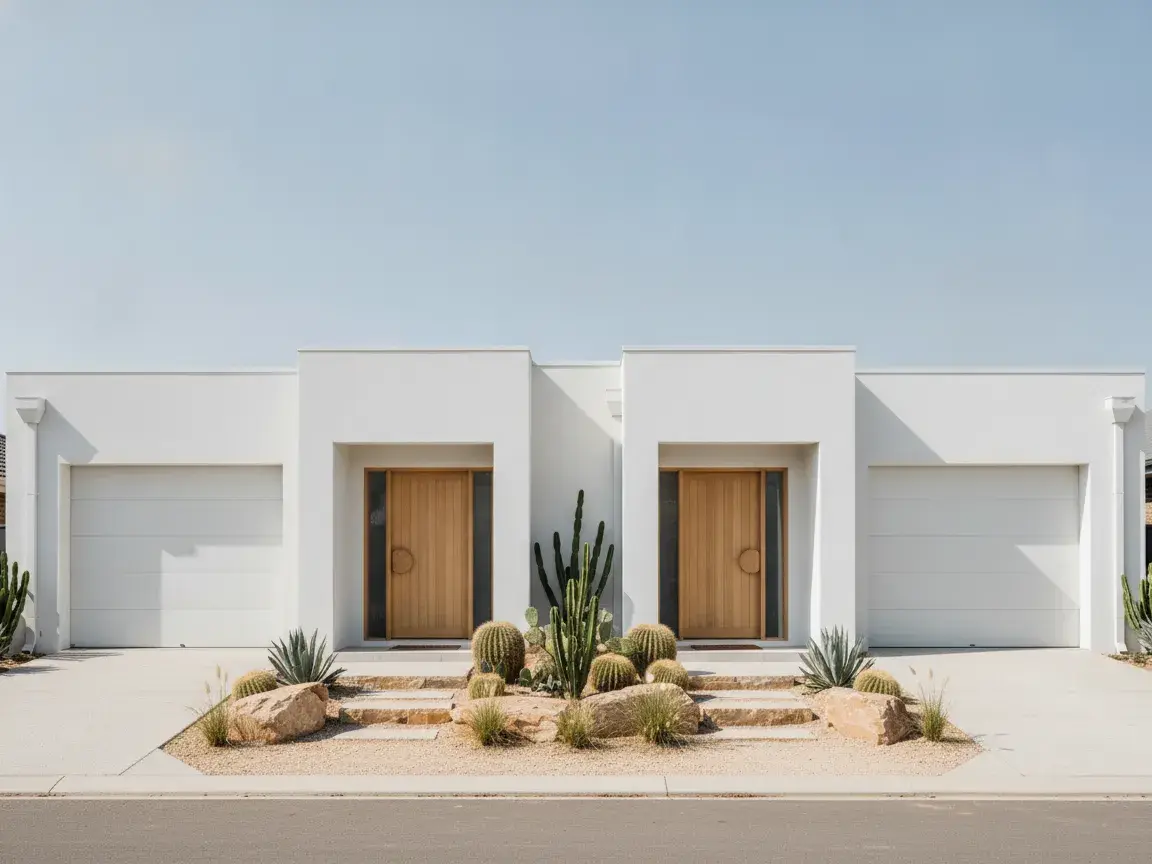
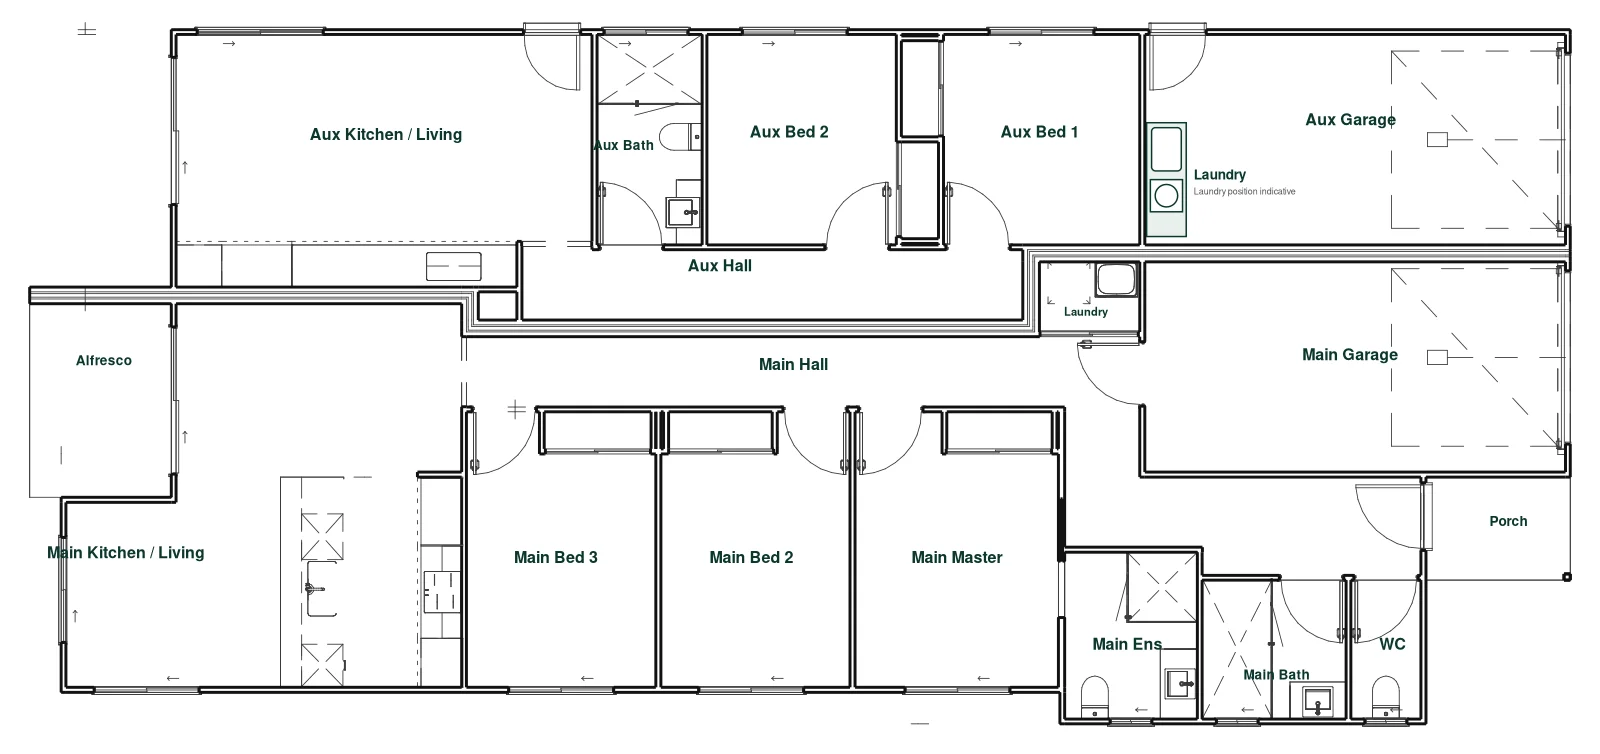
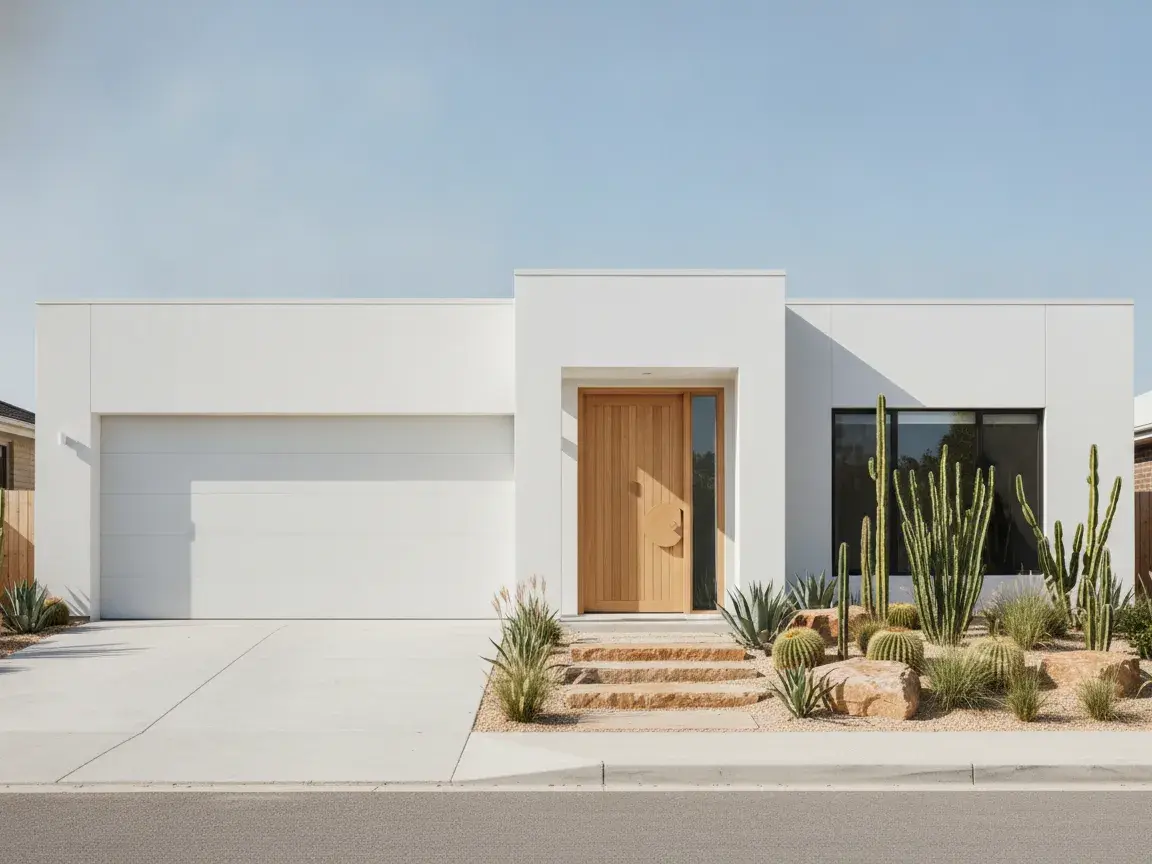
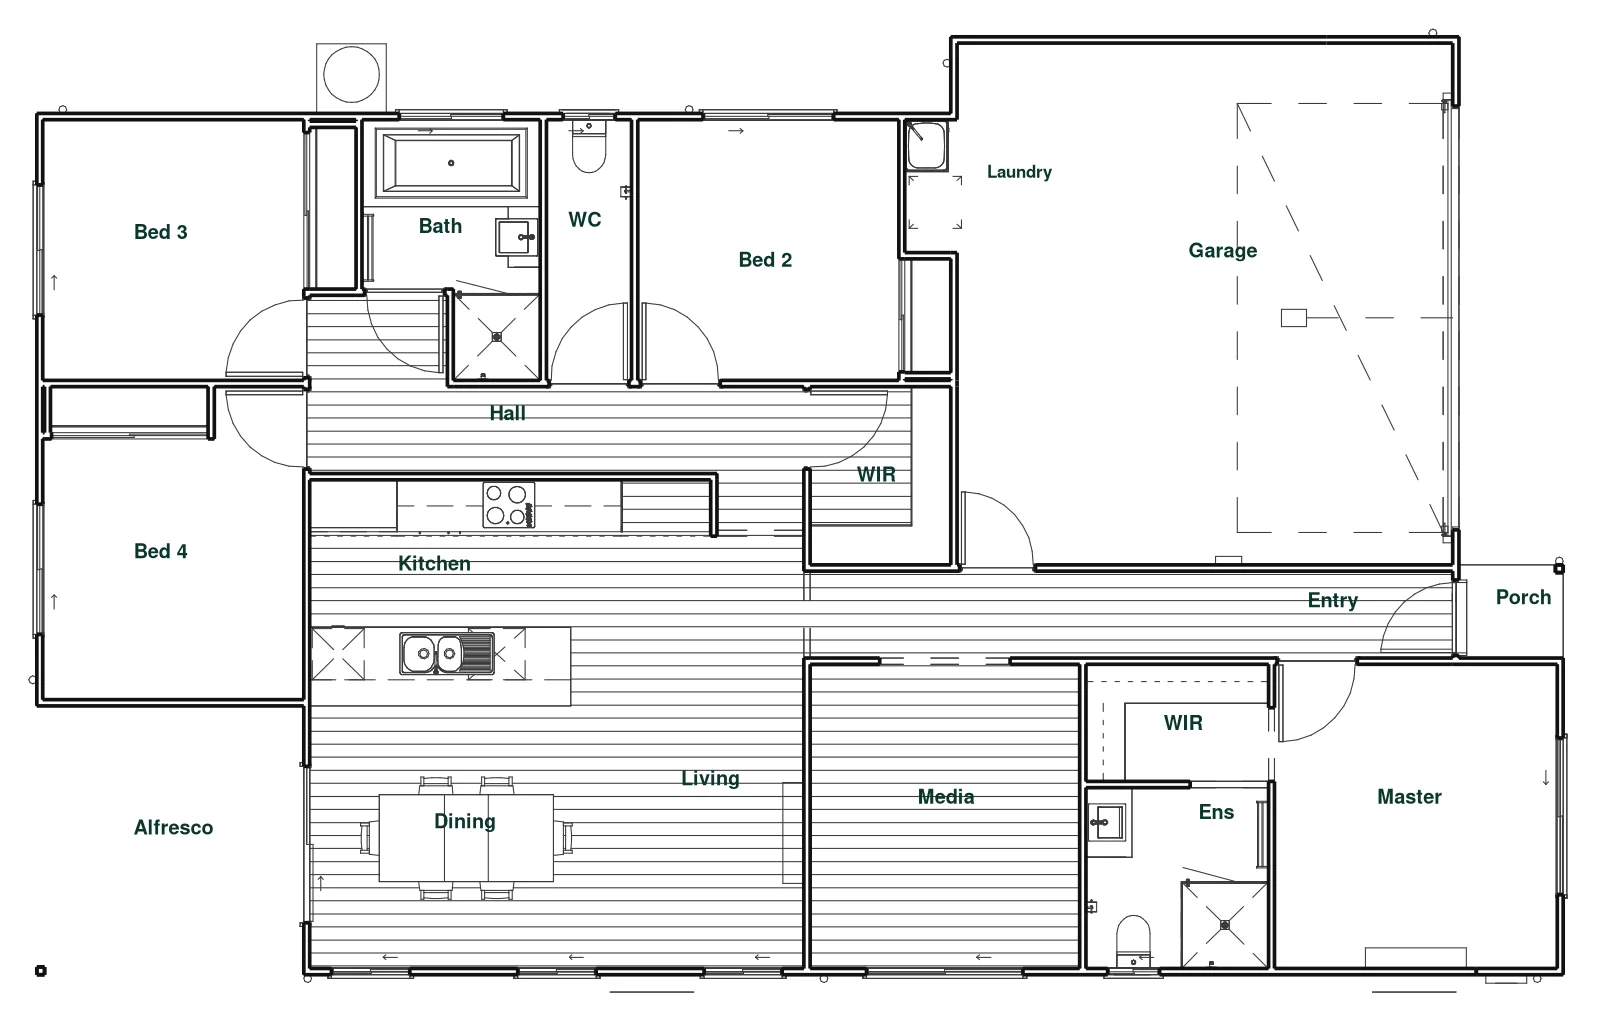
Design renders and floor plans, shown for illustration. Not specific sites or addresses.
Who’s behind this
Tekna Homes, the builder.
Your contact
Joshua James
Your contact
Jake Baird
From Tekna Homes owners
In their words
“An amazing builder is hard to find. We wish to extend our sincere appreciation to you and your team for crafting an exceptionally beautiful first home for us. We eagerly anticipate the opportunity to collaborate with you again in the future.”
Garret and yves
“We got the keys! Building with Tekna Homes has been a dream and I cannot believe they got this home done in 5 months! Highly recommend if you're looking to build a new home in South East Queensland.”
Pamela
Book a meeting
Got clients who’d suit a new build?
Talk through this deal with JoshuaNot every buyers agent likes doing new builds. If you’ve got clients who might suit one, book a quick meeting. No pitch deck, no pressure. Call Joshua on 0477 738 025 or Jake on 0488 557 110, use the form or email homes@tekna.com.au. We rank suburbs on their fundamentals. We don’t promise a sale price.
Ready to send
Your message is ready to send.
Open your email app to send it to homes@tekna.com.au. If the app does not open, write to that address or call Joshua on 0477 738 025 or Jake on 0488 557 110.
Open email to homes@tekna.com.auData sources
Where every figure comes from
Each number on this page traces back to one of the sources below. Measured figures come from sales records and published statistics; anything we estimated or assumed is labelled as a Tekna estimate or Tekna assumption where it appears. End values are estimates, to be confirmed by valuation.
| Source | What it supplies | Coverage | Date |
|---|---|---|---|
| Hedonic sold-listings database (Tekna) | Tile benefit range ($13k–$28k) and the +$30k package ceiling; vanity mentions (23, no clear effect measured) | 10,060 sold records in postcode 4570 (2006 to Aug 2026). Model: 1,437 Gympie-area house sales from 2023, R² 0.74. Mentions: tiles 55, vanity 23 | Sales to Aug 2026 · analysed Oct 2026 |
| Hedonic model, full_hedonic_20261026 (Tekna) | Model base without ducted ~$710k–$760k; ducted +7.9% (n=85, already in the build); 900mm appliances +5.1% (n=34, 95% CI +0.8% to +9.6%); premiums for smaller extras (not to be stacked) | 781 Southside house sales, 2015–2026, using listing text and photo analysis. Recent-sale error ~10% (~$67k). House premiums, not duplex. Photo-based parts provisional until the fine-tuned model reruns | 26 Oct 2026 |
| Tekna price book | Upgrade cost over the standard allowance: 900mm appliances (U9A, $2,700); standard vanity ($1,275); standard mirror (PEM106, $71); brass vs chrome tapware (14279-LF, FSRSBB, 14520 vs 54198, AR02210, AX16350); vinyl and prep (VPPOLARIS, LFPREP); wall tiling and laying | Current price book lines, per item | Prices updated May–Sep 2026 |
| Supplier retail prices | The Blue Space: Otti Bondi 1200 wall-hung vanity $1,465 (sale). Future Glass: Kira arch mirror 960×560 $312. Surface Pro Flooring: polished concrete $90–$140/m². Wilson Timbers and Bunnings: Colonial 138×18 skirting $6.05–$6.93/m. Johnson Tiles: checkerboard floor (price record to be attached) | One product per upgrade, supply only | Checked 23 Oct 2026 |
| Tekna concept floor plan | Layout: two single-storey homes, four bedrooms and two bathrooms each; tile area (~26 m² extra, our take-off) | This project | 2026 |
| Sold sales (public) | 12 Farmer Ct $725k (8 May 2026); 1 Brickfields Cres $715k (16 Jan 2026) | Southside · Farmer Ct 3-bed duplex/semi; Brickfields may be a house | 2026 |
| Tekna job records | Land $345k (settled); build $599.75k for both sides (Tekna build estimate; source document to be attached) | This project | Oct 2026 |
| REA (realestate.com.au) | House median ~$820k, 171 sales, days on market; 4-bed median $857.5k (background only); sales per year; past median falls | Southside, 12 months and calendar years | 12m to Sep 2026 |
| Heatmaps · Onthehouse AVM | Alternative median estimates ($786k, $837k) | Southside | Jan–Sep 2026 · Sep 2026 |
| SQM Research | Rental vacancy 0.63% | Postcode 4570 | Sep 2026 |
| Residential Tenancies Authority (Qld) | New-lease rents: 4-bed $680/wk, 3-bed $650/wk, postcode $580/wk | New bonds lodged | Sep qtr 2026 |
| Australian Bureau of Statistics | Population (9,079, +5.4%); household income and tenure (Census); dwelling approvals; business counts; CPI, unemployment and wages | Gympie–South SA2; Gympie council area; Qld and Australia | Census 2021 · Jun 2025 · Aug–Sep 2026 |
| Queensland Government Statistician (QGSO) | Projected dwelling need (2026–31, medium series); lot approvals and approved-lot pipeline | Gympie council area | Mar qtr 2026 |
| Qld Dept of Education · ACARA | Gympie South State School enrolments (518) and ICSEA (955) | One school | Aug 2025 · 2025 |
| Transport and Main Roads (Qld) | Gympie Bypass opening | Project record | Oct 2024 |
| Gympie Regional Council | Southside growth area structure plan; flood mapping (lot check pending) | Council planning records | Jan 2017 |